Spring Boot Application Monitoring through Actuator & Micrometer
Micrometer integration with Prometheus and Grafana
Overview:
This document explains the integration of spring boot application with actuator & micrometer monitoring. We can show graphical representation of Java heap memory, GC invocation statistics, etc. through Prometheus and Grafana
Description :
The spring-boot-actuator module provides all of Spring Boot’s production-ready features.
Actuator endpoints let you monitor and interact with your application. Spring Boot includes a number of built-in endpoints and lets you add your own. For example, the health endpoint provides basic application health information.
Each individual endpoint can be enabled or disabled and exposed (made remotely accessible) over HTTP or JMX. An endpoint is considered to be available when it is both enabled and exposed. The built-in endpoints will only be auto-configured when they are available. Most applications choose exposure via HTTP, where the ID of the endpoint along with a prefix of /actuator is mapped to a URL. For example, by default, the health endpoint is mapped to /actuator/health.
Technology Stack :
| Technology | Version |
|---|---|
| Core Java | Adopt Open JDK 8 |
| Spring Boot Web | 2.3.0.RELEASE |
| Spring Boot Actuator | 2.3.0.RELEASE |
| Micrometer | 1.5.1 |
Tools :
| Tool | Version |
|---|---|
| Maven | Apache Maven 3.5.0 |
| Prometheus | Prometheus 2.19.0 |
| Grafana | Grafana-7.0.3 |
Actuator configruation:
By default, all endpoints except for shutdown are enabled. To configure the enablement of an endpoint, use its management.endpoint.
management.endpoint.shutdown.enabled=true
If you prefer endpoint enablement to be opt-in rather than opt-out, set the management.endpoints.enabled-by-default property to false and use individual endpoint enabled properties to opt back in. The following example enables the info endpoint and disables all other endpoints:
management.endpoints.enabled-by-default=false
management.endpoint.info.enabled=true
To change which endpoints are exposed, use the following technology-specific include and exclude properties:
| Property | Default |
|---|---|
| management.endpoints.jmx.exposure.exclude | |
| management.endpoints.jmx.exposure.include | * |
| management.endpoints.web.exposure.exclude | |
| management.endpoints.web.exposure.include | info, health |
The include property lists the IDs of the endpoints that are exposed. The exclude property lists the IDs of the endpoints that should not be exposed. The exclude property takes precedence over the include property. Both include and exclude properties can be configured with a list of endpoint IDs.
For example, to stop exposing all endpoints over JMX and only expose the health and info endpoints, use the following property:
management.endpoints.jmx.exposure.include=health,info
‘*’ can be used to select all endpoints. For example, to expose everything over HTTP except the env and beans endpoints, use the following properties:
management.endpoints.web.exposure.include=*
management.endpoints.web.exposure.exclude=env,beans
Prometheus configuration:
# my global config
global:
  scrape_interval:     15s # Set the scrape interval to every 15 seconds. Default is every 1 minute.
  evaluation_interval: 15s # Evaluate rules every 15 seconds. The default is every 1 minute.
  # scrape_timeout is set to the global default (10s).

# Alertmanager configuration
alerting:
  alertmanagers:
  - static_configs:
    - targets:
      # - alertmanager:9093

# Load rules once and periodically evaluate them according to the global 'evaluation_interval'.
rule_files:
  # - "first_rules.yml"
  # - "second_rules.yml"

# A scrape configuration containing exactly one endpoint to scrape:
# Here it's Prometheus itself.
scrape_configs:
  # The job name is spring boot application name.
  - job_name: 'spring-application'
    metrics_path: '/application/actuator/prometheus'
    scrape_interval: 5s
    static_configs:
    - targets: ['localhost:8080']
pom.xml configuration:
- Add below mentioned depenedecy for actuator
<dependency> <groupId>org.springframework.boot</groupId> <artifactId>spring-boot-starter-actuator</artifactId> </dependency> - Add below mentioned depenedecy for micrometer
	<dependency>
		<groupId>io.micrometer</groupId>
		<artifactId>micrometer-registry-prometheus</artifactId>
	</dependency>
- Add below mentioned depenedecy for micrometerJVM attributes
	<dependency>
		<groupId>io.github.mweirauch</groupId>
		<artifactId>micrometer-jvm-extras</artifactId>
		<version>0.1.3</version>
	</dependency>
Note: micrometer-jvm-extras artifact version is taken from maven repository. Please check for latest one.
Prometheus Bean configuration:
- Register MeterRegistery of Micrometer
```java
/**
- Configurer. *
- @param applicationName the application name
- @return the meter registry customizer
*/
@Bean
MeterRegistryCustomizer
configurer( @Value("${spring.application.name}") final String applicationName) { return (registry) -> registry.config().commonTags("application", applicationName); } ``` **Note:** To register above mentioned bean, we need micrometer-registry-prometheus dependency.
– Create bean of MemoryMetrics and ThreadMetrics
	/**
	 * Process memory metrics.
	 *
	 * @return the meter binder
	 */
	@Bean
	public MeterBinder processMemoryMetrics() {
		return new ProcessMemoryMetrics();
	}

	/**
	 * Process thread metrics.
	 *
	 * @return the meter binder
	 */
	@Bean
	public MeterBinder processThreadMetrics() {
		return new ProcessThreadMetrics();
	}
Note: To create above mentioned bean, we need micrometer-jvm-extras dependency.
Prometheus
- You can download prometheus from - Here Note: For linux version OR Docker version please visit - Prometheus site
- Extract prometheus-2.19.0.windows-amd64.tar.gz to prometheus-2.19.0
- Replace prometheus.yml configuration file from $(project_directory)/src/main/resources/prometheus.yml to prometheus-2.19.0/bin/ folder.
- Start prometheus query executor from using prometheus-2.19.0/bin/prometheus.exe
- Launch http://localhost:9090/graph from browser.
CPU Usage |
Logback Usage |
Memory Swap Usage |
Grafana
- Download Grafana from - Here Note: For linux version OR Docker version please visit - Grafana site
- Extract grafana-7.0.3.windows-amd64.zip to grafana-7.0.3
- Start grafana from using grafana-7.0.3\bin\grafana-server.exe
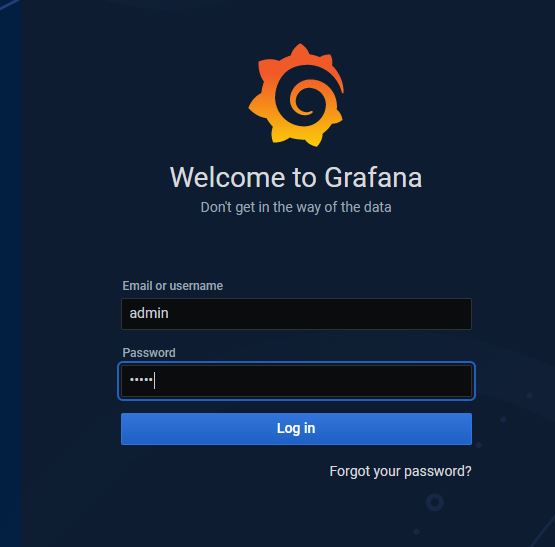
- Launch http://localhost:3000/ from browser. Default username and password is admin / admin for grafana.
Grafana configuration:
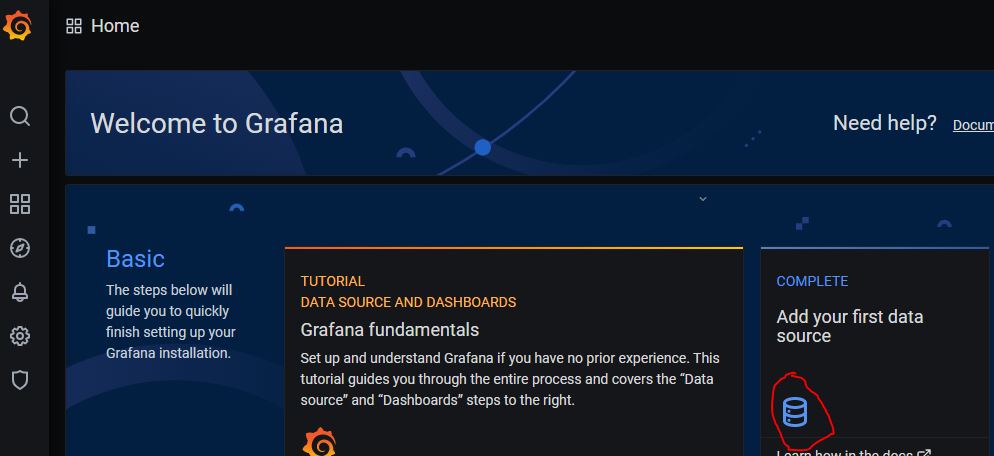
- Data source
- Add your first data source.
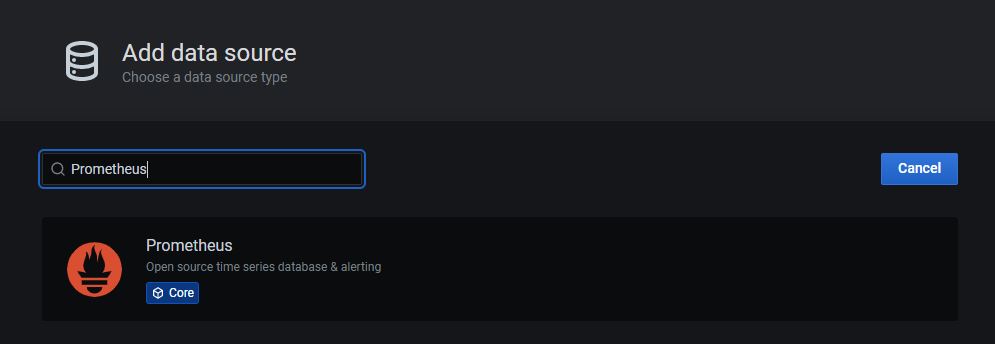
- Select prometheus data source from list of data-sources.
- Add prometheus data source details.
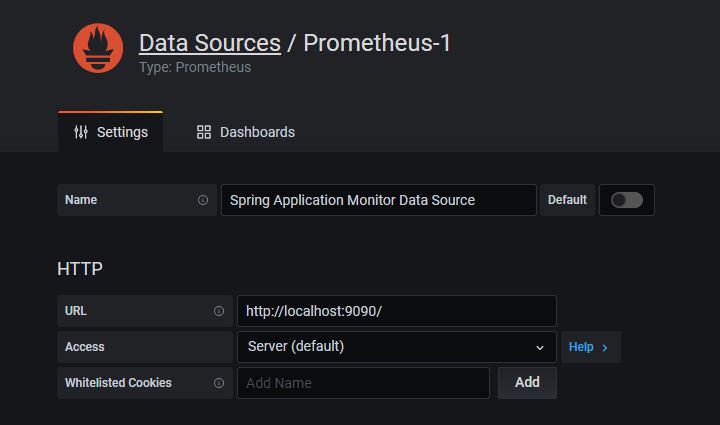
- Test & Save data source.
- Add your first data source.
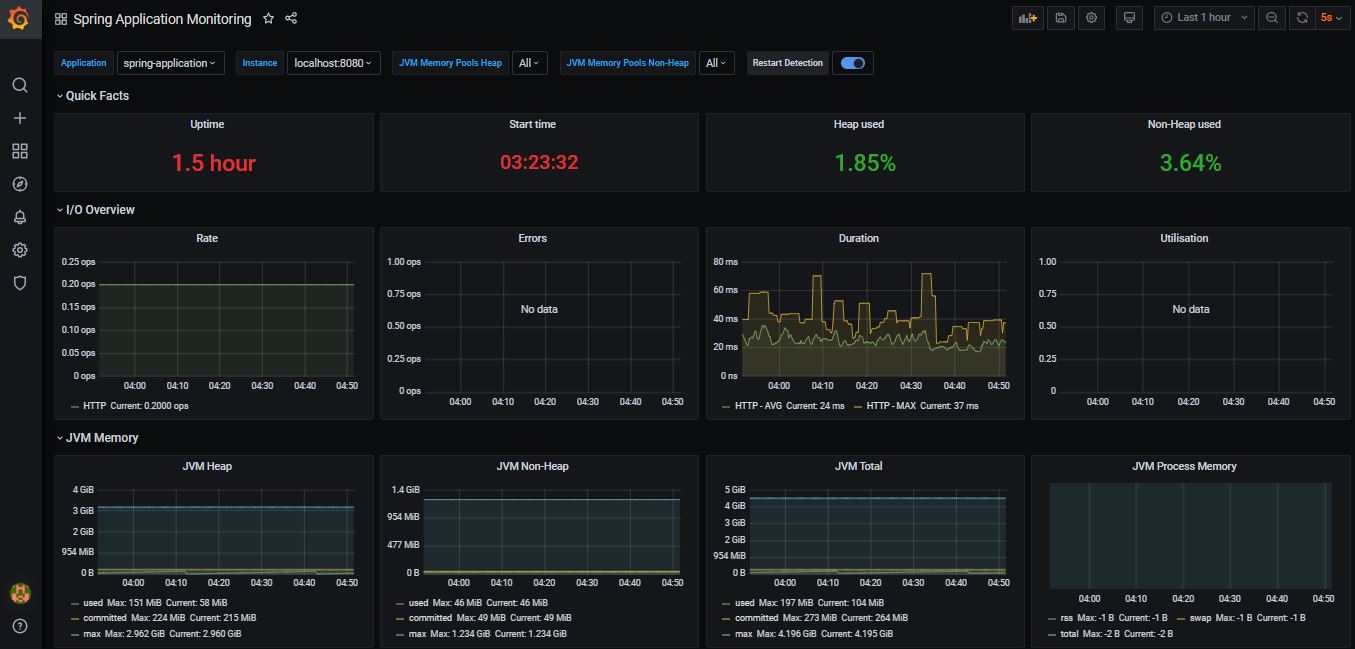
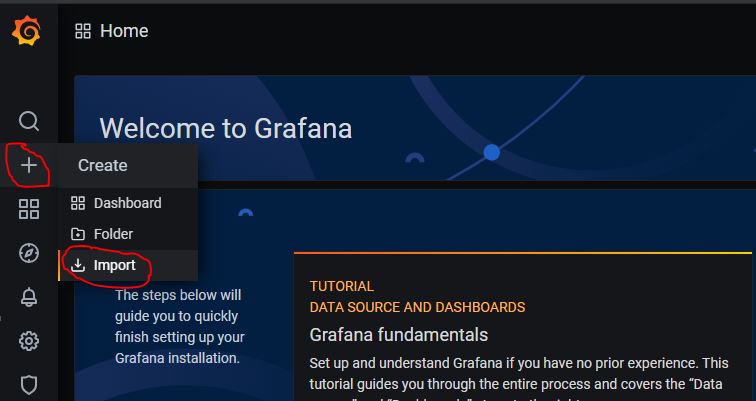
- Dashboard
- Import dashboard with (+) sign
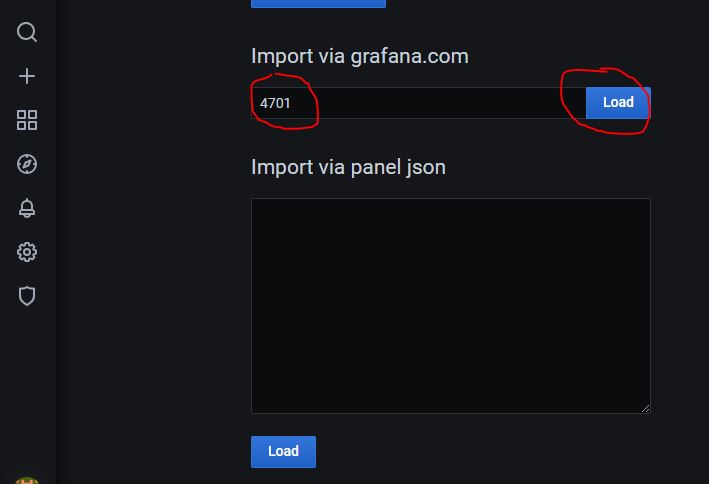
- Import JVM (Micrometer) dashboard by ‘Import Via Grafana.com’
- Edit dashboard name & datasource.
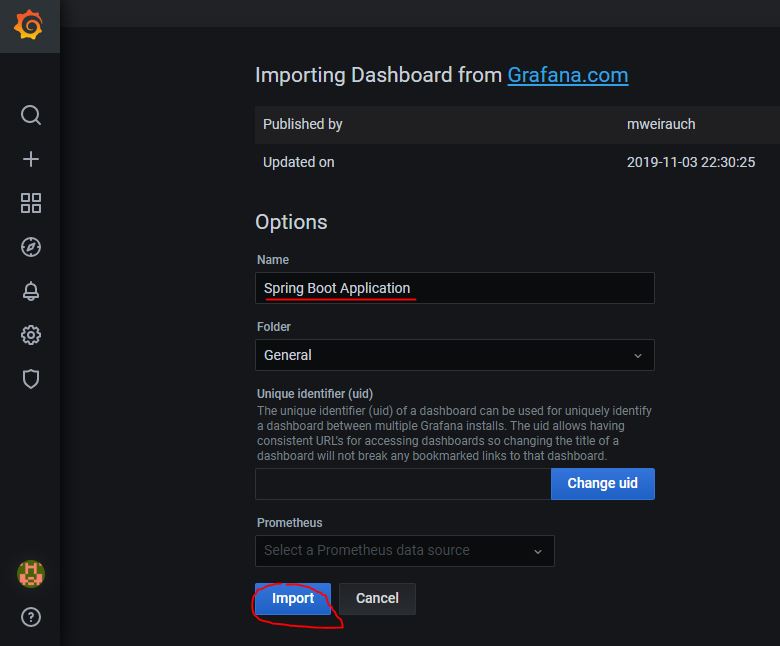
- Save dashboard
- Import dashboard with (+) sign
Dashboard screen 1 |
Dashboard screen 2 |
Dashboard screen 3 |
Dashboard screen 4 |
Post Owner Information:
| Description | Github Profile Link | LinkedIn Profile Link | Email Address |
|---|---|---|---|
| Bhushan Patil | ravaan.techky@gmail.com |
spring-boot-with-prometheus is maintained by ravaan-techky.